 Qarote
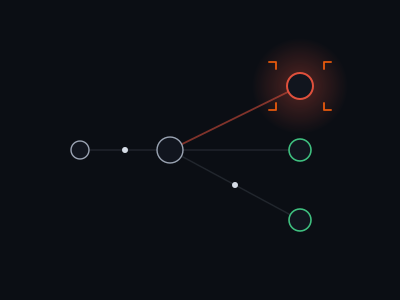 incident · scan
Debugging a RabbitMQ consumer crash from your editor

It’s 15:06. A deploy goes out. Six minutes later, the page fires: orders.incoming depth is climbing and nothing is draining it. The old way: open a dashboard, find the queue, eyeball charts, correlate by hand. Here’s the agent-first way — where you never leave your editor.
The premise. If Qarote can answer it over MCP, you shouldn’t have to click for it. The whole investigation below happens in a chat with your agent.
Start by asking, not clicking
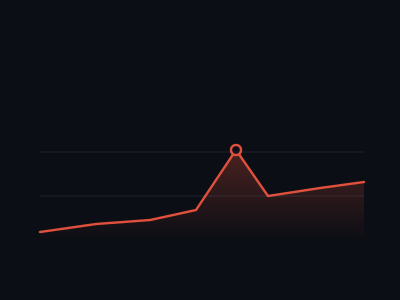
With Qarote wired over MCP, the first move isn’t a click — it’s a plain question. The agent calls list_incidents, sees the open critical, and pulls the detail with get_incident. No tab-switching, no hunting through a queue list.
you ▸ what's wrong with my rabbitmq?

agent ▸ called list_incidents · get_incident
orders.incoming lost its 3 consumers at 15:06;
depth climbing ~8k/min with zero drain.
That’s the what, and it took one sentence. The rules engine had already flagged it deterministically — the agent just read the finding.
Let it explain the root cause
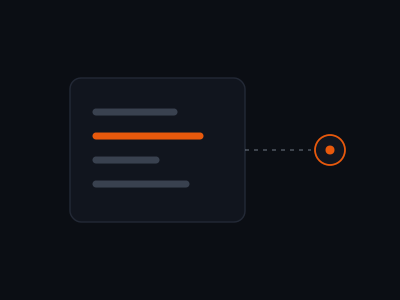
Detection tells you what happened. explain_finding tells you why by feeding the incident plus the surrounding broker state to an LLM and asking it to reason over the timeline.
The 3 consumers disconnected simultaneously at 15:06 —
a crashed worker pool, not one bad instance. Timing lines
up with the 15:05 deploy. Check that build's logs; roll
back if workers aren't re-subscribing.
↳ co-firing: events.payment also lost consumers.
The co-firing line is the tell. Two unrelated queues losing consumers in the same window points at a shared worker pool, not at RabbitMQ itself. That redirects the investigation away from the broker and straight at the 15:05 deploy.
Detection is deterministic and free; the explanation is on-demand. The RCA only generates when you ask — it never auto-fires and never silently bills you.
Confirm and move on
You roll back the 15:05 deploy, watch the consumers re-subscribe, and the depth drains. Total time spent in a dashboard: zero.
- What came from the rules engine, instantly.
- Why came from one
explain_findingcall. - Where to look — the 15:05 deploy — came free in the same answer.
The fix took five minutes. Finding it took one question.
Building agent-native RabbitMQ diagnosis. Previously spent too many on-call nights staring at queue charts — which is roughly why Qarote exists.
Try it on your own broker.
Connect in under two minutes, wire your agent, and ask it what's wrong.