 Qarote
 root cause
Why root-cause beats dashboards

A dashboard is a wonderful thing right up until 3 a.m. Then it becomes twelve panels of squiggly lines and a question it can’t answer: why. You can see orders.incoming climbing. You can see the consumer count drop. What you can’t see is the connection between them, or what tripped them, or what to do next. That connective work is still yours.
Dashboards answer “what changed”
Visualization is great at showing deltas. A line goes up, a count goes down, a rate flattens. That’s genuinely useful — but it’s the easy half of the problem. The hard half is causation, and a chart can’t draw a causal arrow for you. It shows two things moving and leaves the inference to a tired human at the worst possible hour.
So you do what everyone does: open a second tab, line up timestamps by eye, remember there was a deploy around then, go check. Every step is manual correlation that the data already contains but the dashboard won’t perform.
Charts are for confirming a hypothesis, not forming one. By the time a graph is useful you already need to know what you’re looking for.
Explanation is the bottleneck
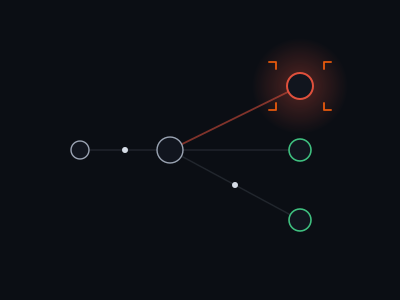
On call, you are not short on data. You are short on interpretation. The metrics exist; the logs exist; the deploy history exists. What’s missing is the sentence that ties them together: “three consumers dropped at 15:06, same window as the deploy, and a second queue dropped its consumers too — so it’s a shared worker pool, not the broker.”
Producing that sentence is the actual job. Everything before it is plumbing.
Explanation-first flow
Qarote inverts the order. A deterministic rules engine detects the condition — consumers lost, depth climbing with no drain — the instant it happens, no chart-staring required. That’s the what, and it’s free.
When you want the why, you ask. explain_finding feeds the finding plus the surrounding broker state to an LLM and returns the causal narrative, including co-firing signals across queues that a single panel would never have surfaced. You get the hypothesis handed to you, then you confirm it — which is exactly what a dashboard is good for.
The point isn’t that charts are useless. It’s that they’re step three. The explanation is step one, and that’s the step worth automating.
Building agent-native RabbitMQ diagnosis. Previously spent too many on-call nights staring at queue charts — which is roughly why Qarote exists.
Try it on your own broker.
Connect in under two minutes, wire your agent, and ask it what's wrong.